From Reactive Planning to Predictive Operations
There is a ₹128 crore cashflow forecast inside a construction company right now that nobody trusts. It was compiled last Thursday from three systems, two WhatsApp groups, and a site engineer's notebook. By Monday morning, two input assumptions had already changed.
There is a ₹128 crore cashflow forecast inside a construction company right now that nobody trusts. It was compiled last Thursday from three systems, two WhatsApp groups, and a site engineer's notebook. By Monday morning, two input assumptions had already changed.
Every large infrastructure company has scheduling software, ERstems, and project management tools. The tools exist. What does not exist is the ability to ask "which of our 48 projects is about to miss its next billing milestone?" and get an answer in under 10 seconds from live data.
Today that question takes a week of manual compilation. By the time the answer reaches leadership, the window to intervene has closed.
We built a system that compresses that cycle from days to seconds.
What the Platform Does
Ten capabilities. Each one specific, operational, and live.
Schedule Optimization. Direct MSP schedule import, automated normalisation, activity sequencing, and dependency mapping. No manual re-entry.
Slippage Detection. Nightly analysis across every active activity on every project. Projects finish dates from current completion rates, classifies severity, calculates cascade impact on downstream activities. Leadership knows the next morning, not at the next weekly review.
AI Planning Copilot. Natural language interface connected to the full project knowledge graph. "Why is Block B behind?" "What happens if monsoon delays the pour by two weeks?" "Which subcontractor has the worst delivery record?" Grounded answers from live data, not guesswork.
Automated MIS Reporting. System-generated weekly and monthly reports covering schedule, cost, risk, subcontractor performance, and cashflow. Delivered to role-based distribution lists. The two-to-three day monthly compilation process is gone.
Subcontractor Performance and Risk Analysis. Data-driven scoring from historical delivery records. Risk Register that identifies emerging risks, scores by probability, impact, and proximity, and recommends mitigations with owner assignment.
AI Workflow Automation. Approvals, alerts, escalations, and process triggers that run without manual intervention. Critical path slippage alerts go out that same night with cascade impact and corrective actions attached.
Bids and Quantity Surveying. BOQ mapping that connects bid assumptions to live execution data. Margin erosion surfaces as it builds, not after the project closes. Every completed project sharpens the next estimate.
Real-Time Project Monitoring. Live progress tracking with validation layers that flag improbable updates before they commit. Every submission triggers automatic plan recalculation.
Critical Path Analysis. Continuous CPM calculation. When total float hits zero on an activity chain, leadership knows immediately. Corrective action windows measured in hours.
Cost and Schedule Optimization. Full EVM in real time: CPI, SPI, EAC, VAC at activity, WBS, and project level. S-Curve and cashflow engines showing planned, actual, and forecast trajectories. When CPI drops to 0.82, the system identifies exactly where the overrun is building.
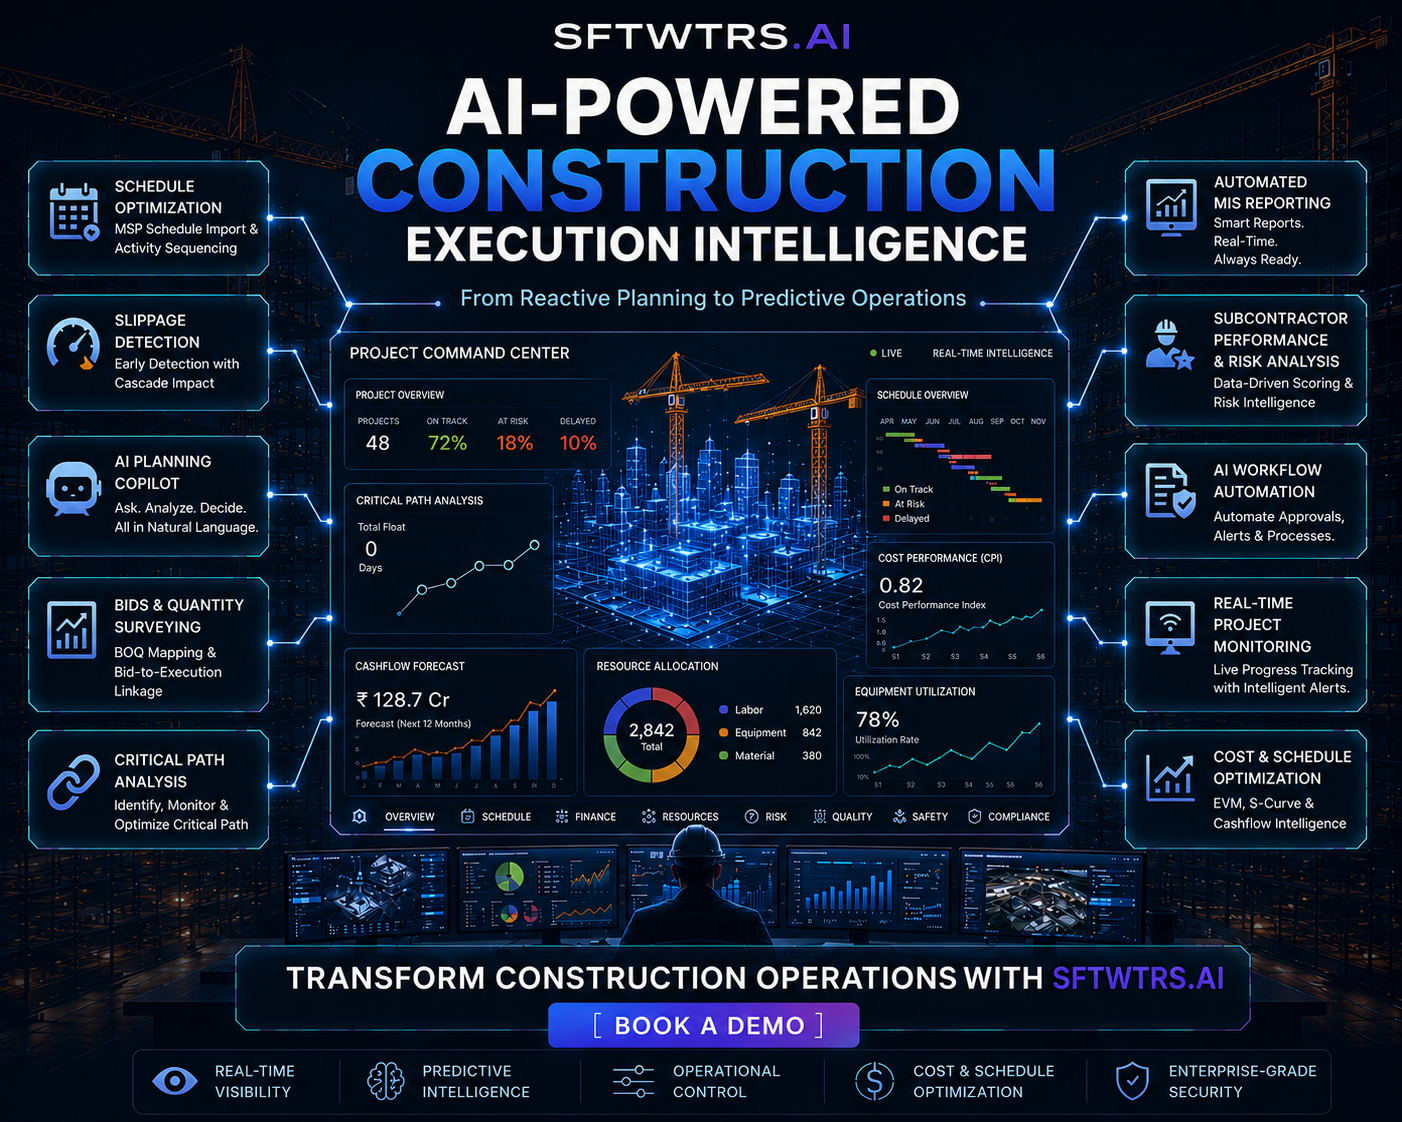
The Project Command Center
Everything converges here. Real-time health of every project across the portfolio. 48 projects. 72% on track. 18% at risk. 10% delayed. Updated continuously.
Schedule status, critical path, cost performance, cashflow forecasts, resource allocation, equipment utilisation — all in one view. Navigation spans Overview, Schedule, Finance, Resources, Risk, Quality, Safety, and Compliance. Same underlying data layer. No reconciliation gaps between what finance sees and what the project team sees.
Why One Platform, Not Five Point Solutions
Construction execution is interconnected. A delay affects cost, which affects cashflow, which affects subcontractor payments, which affects their next milestone delivery, which creates more delay. You cannot trace these cascading effects across five separate tools that do not share data.
The platform uses a knowledge graph that holds schedules, costs, resources, subcontractors, risks, and milestones in a single connected structure. When you ask "why is Block B behind?", the system traces across schedule data, resource allocation, subcontractor performance, material delivery, and weather impact. One answer. Under ten seconds.
What Comes Next
The Norm Refinement Engine. After each projt phase, the system compares planned productivity norms against actuals, identifies which norms are consistently optimistic or pessimistic, and proposes statistically grounded updates. Every completed project makes the next one more predictable.